
How One Number Measured the Market’s Panic During COVID
What is the VIX?
Let’s start with the basics:
The VIX is Wall Street’s Fear Meter.
- It’s short for Volatility Index
- It tracks how much investors think the stock market will swing over the next 30 days
- The higher the VIX, the more fear there is
Think of it like a financial seismograph—when it spikes, the ground is shaking.
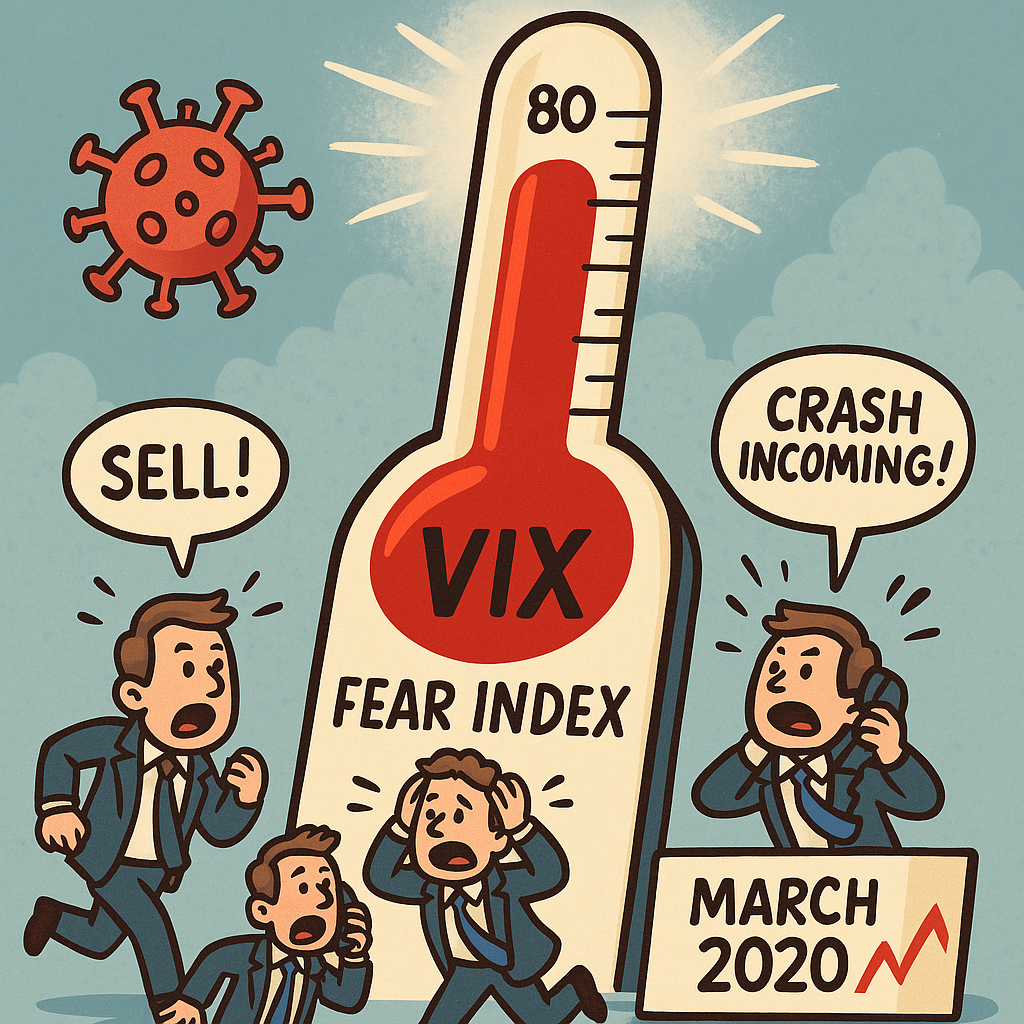
What Happened During COVID?
In March 2020, the VIX didn’t just rise…
It exploded.
- On March 16, 2020, it hit 82.69
- That was higher than the peak during the 2008 crash
- It meant investors expected wild swings, huge drops, and total uncertainty
It was one of the clearest signs that the market was freaking out.
What Does a High VIX Really Mean?
A VIX above 30 = 🚨 warning signs
A VIX above 80 = 🚨🚨 total panic mode
It tells you:
- Investors are buying protection (like options)
- Everyone expects massive price swings
- Risk is through the roof
It doesn’t cause the crash, but it measures the fear behind it.
The VIX is one of the easiest ways to check the mood of the market.
It teaches you:
That calm minds win in the long run
How to measure emotional pressure in finance
When not to panic (even if everyone else is)